

3 Ways to Measure pH in Lakes and Reservoirs
pH is a principal indicator of changing water chemistry in lakes and reservoirs. The pH scale ranges from 0 to 14, with values below 7 indicating acidity and values above 7 indicating alkalinity. A stable pH reading does not always reflect stable chemistry in surface waters, where inflows, sunlight, temperature, and biological activity drive rapid changes. During productive periods, shifts can occur within hours, and a single weekly measurement may miss critical trends. Operators and researchers should evaluate which of the three approaches to measuring pH provides the needed accuracy and continuity for informed decisions. For a definition of pH in natural waters, reference the USGS materials on pH and water. For bloom risk in freshwaters, refer to NOAA’s HAB overview as a starting point.
Why is it important to measure pH?
pH serves as an operational diagnostic tool. It influences metal solubility, nutrient availability, disinfection efficiency, and biological stress thresholds. In lakes and reservoirs, pH also signals biological activity: photosynthesis raises pH during daylight, while respiration lowers it at night. During algal blooms, the daily swing can be more pronounced. In industrial and drinking water treatment, pH changes during algal activity can affect coagulation efficiency, chemical dosing, and overall operational stability. A detailed LG Sonic guide on pH and algae in industrial water is available for further context. Elevated afternoon pH together with rising pigment levels can indicate intensified bloom activity and greater treatment pressure.
What controls pH in lakes and reservoirs?
Most freshwater systems buffer pH through alkalinity and carbonate chemistry. Carbon dioxide exchange, inflows, stratification, and biological uptake all influence pH variability. Under calm, sunny conditions, surface waters exhibit daily cycling: pH rises during peak photosynthesis and declines overnight. In stratified reservoirs, vertical differences can emerge; surface layers may remain stable while deeper layers shift due to respiration and reduced mixing. When blooms intensify, these cycles often amplify, making trend analysis more valuable than isolated readings.
3 ways to measure pH
Below are three practical approaches used in most monitoring programmes. Each method serves a different operational purpose: spot verification, rapid screening, or continuous system tracking.
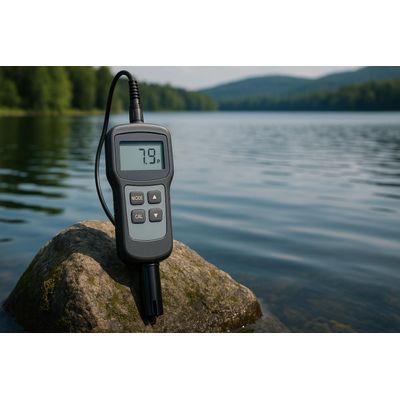
1) Handheld meter with glass electrode
Most professional pH meters use a glass electrode that measures electrical potential changes caused by hydrogen ion activity. This electrochemical method provides direct numerical readings suitable for field surveys and compliance sampling. A handheld pH meter is versatile and reliable when properly maintained. However, accuracy depends on operational discipline.
- Calibration frequency: Calibrate daily during active monitoring using at least two buffers (commonly pH 7 and pH 10).
- Probe drift: Reference junction aging and membrane fouling can gradually shift readings.
- Bloom conditions: Organic matter and biofilm can coat the electrode, slowing response time.
- Temperature compensation: Measure temperature simultaneously, as pH response varies with thermal conditions.
Laboratory pH measurements often achieve ±0.01 accuracy under controlled conditions, whereas field measurements may vary due to temperature shifts, fouling, and handling differences. Handheld meters are flexible but require consistent maintenance and validation against standards.
2) Colorimetric indicators: strips and field kits
Indicator strips and simple kits trade precision for speed. They are useful for screening; they are also beneficial when multiple readings are needed quickly, or when training new staff. Their strength is directionality: you can confirm whether water is near neutral, or clearly more alkaline or acidic. However, these methods have limitations:
- Accuracy: typically within ±0.5 pH units.
- Interferences: high turbidity, salt concentration, or organic matter can distort color interpretation.
- Temporal resolution: they do not capture short-term variability.
For operational decision-making in reservoirs, these tools are best used as supplementary methods rather than primary monitoring. For a quick visual representation of typical ranges, USGS publishes a pH scale graphic to help teams align on what the numbers mean.
3) Continuous sensors with data logging
Continuous pH sensors provide temporal resolution that periodic manual sampling cannot match. By logging data at regular intervals, they reveal daily cycles, rapid shifts, and seasonal trends.
- Operational advantages: detection of abnormal pH excursions within hours; identification of bloom-related volatility; trend-based decision-making rather than isolated readings.
- Depth considerations: in stratified reservoirs, sensor depth matters; surface readings may not reflect deeper layer conditions, particularly during oxygen depletion events.
- Integration: when monitoring data is integrated with chlorophyll-a, phycocyanin, dissolved oxygen, and temperature, it contributes to an early-warning framework.
LG Sonic’s monitoring systems provide real-time insight into pH variability and bloom indicators. The MPC-Buoy integrates monitoring with ultrasound-based prevention to stabilize conditions before treatment operations are affected, reducing peak biomass and operational stress on drinking water infrastructure.
How blooms shift pH through the day
Algal blooms alter carbon dioxide dynamics. During daylight, photosynthesis removes CO2, increasing pH. At night, respiration releases CO2, lowering pH. In dense cyanobacterial events, afternoon pH values can rise significantly above baseline, potentially coinciding with green water accumulation in sheltered zones due to wind-driven surface transport. Understanding this pattern helps operators interpret daily fluctuations within a biological context. An example of elevated pH associated with blooms is discussed in open-access literature.
Effects of algal blooms on drinking water
Reservoirs used for drinking water are particularly sensitive to bloom-related instability. As blooms intensify, operators may observe increased organic load, greater taste-and-odour events, treatment inefficiencies, and reduced filter runtime. In surface waters, pH values above 9 during bloom peaks can increase coagulation challenges and reduce treatment efficiency. Tracking pH trends alongside pigment data helps determine whether bloom activity is intensifying and whether intervention thresholds are approaching. Relevant regulatory and technical references summarize bloom drivers and impacts.
Ways you can prevent algal blooms in water
- Build a routine: same stations, similar times of day; that is how trends become comparable.
- Use early-warning thresholds: a rising pH trend plus pigment increase usually signals growing bloom pressure.
Operational response to persistent bloom pressure
Where monitoring shows persistent bloom pressure, targeted ultrasound-based management can help limit bloom development in the photic zone. Teams combine real-time data with field verification; they check pH trends, pigment signals, and visual conditions, then adjust programmes as the season changes.
Conclusion
pH is not merely a chemistry parameter; it is a practical indicator of biological and chemical stability in lakes and reservoirs. The three ways to measure pH — handheld meters, indicator methods, and continuous sensors — serve different operational roles. When combined with broader monitoring strategies, pH data supports earlier detection of bloom development, more informed intervention decisions, and improved stability in drinking water systems.
Original: https://www.lgsonic.com/insights-3-ways-to-measure-ph/