
- Home
- Companies
- Explicit ApS
- Products
- Explicit - Drone Flux Measurement (DFM)
Explicit - Drone Flux Measurement (DFM)
A new highly accurate drone-based method of measuring fugitive climate gases from different sources. Developed by Explicit, the DFM method uses a sniffer drone integrated with high performance gas and wind sensors. Emissions impact both climate and air quality significantly, yet many of the sources remain scarcely documented. Using the DFM method, we can monitor them correctly to help you implement the right mitigating actions.
- Suitable for different gases
- Single-person set up
- Easy deployment over land and sea
- No interference with site operations
- Independendency from mean wind
- High accuracy and low detection limit
- Visualisations to support source localisation
- ISO accredited method, patented technology
Site survey & sampling plan
Preliminary analysis of the site: identification of possible sources, risk zones, feasible flight paths etc. Organization of the campaign.
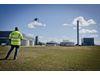
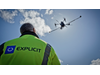
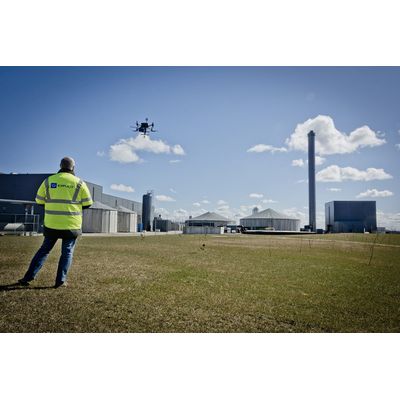
Drone set-up and data collection
Gas and wind sensors are integrated to the drone. Through an adaptive flight pattern, the drone flies a vertical wall downwind from the site of interest, collecting thousands of data points.
Drone set-up and data collection
Gas and wind sensors are integrated to the drone. Through an adaptive flight pattern, the drone flies a vertical wall downwind from the site of interest, collecting thousands of data points.
Emission report
A detailed emission report containing the average emission rates and visualizations to support source localization is presented to the client.
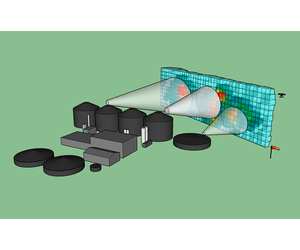
Data are collected downwind from the site of interest, so that the emission plume is entirely intercepted by the drone. Because both gas and wind data are closely correlated in time and space, Explicit is able to accurately calculate the net emission rate (kg/h) across the inspected area and provide a consistent representation of the flux density of the gas flowing from the site.
- Final emission rate is calculated using the data collected during at least 3 flights
- 20 % uncertainty in the final result
- Possibility to quantify subsection contributions
Biogas plants
Isolating and quantifying methane emissions from biogas plants and refineries.
Oil/gas offshore platforms
Quantifyng methane emissions from flares, localizing leaks and identifying super-emitters from oil/gas production.
Waste water treatment plants
Quantifying nitrous oxide emissions from WWTP, which are often overlooked because of the difficulty in monitoring over water.
LNG Bunkering
Monitoring methane leaks during bunkering processes.
Farming
Monitoring diffuse methane emissions from cattle and pigs stables.
Research
Quantifying GHGs reductions when implementing a mitigation action or a new process; Or to validate emission factors and models.
The flight flux density visualisation is plotted on the site map, together with the average wind direction estimated during the flight (orange lines). These visualisations are presented in the emission report and can support the client in the localisation of the sources.