
Mission Communications, LLC
- Home
- Companies
- Mission Communications, LLC
- Services
- Mission Main Map Display
Mission Main Map Display
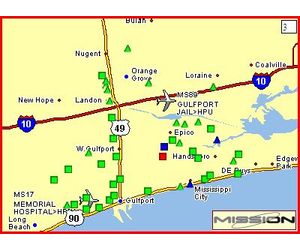
As soon as the user logs in to the Mission website, a map of their devices will be displayed. The shape of each icon shows what type of device it is, and icon is also color-coded as to its current status. The map refreshes every 10 seconds so data displayed is always current. The border color of the map is keyed to the highest level alarm condition displayed on the map.Most popular related searches
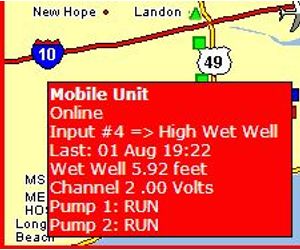
Operation couldn`t be simpler: simply move your mouse over the site in alarm on the map. A small popup will show all the pertinent data at a glance.
- Quickly Assess Problems
- Efficiently Direct Corrective Actions
- Reduce Operator Errors
- Reduce or Eliminate Operator Training
- Web based system
- Continuously updated "World at a Glance"
- System overlaid on geographic map
- “Mouse Over” provides site status detail
- Pop up screens show unit-specific data logs
Benefit
- From the office, home or laptop customers can easily monitor their system status. No special computers or software to maintain.
- See alarm status, where field personnel are and pump run status. Color coded and animated symbols provide simple identification of status or alarm problems.
- Intuitively see localized problems like area wide AC outages, high flows or low water system pressure events.
- Provides instant access to data while preventing the main screen from being confusing or cluttered.
- Access alarm, runtime, rainfall or site access logs with a single click. No confusing menus or commands to remember. Quickly drill down and assess years worth of data. Perfect for CMOM improvement programs.