
- Home
- Companies
- Agilaire, LLC
- Software
- AirVision - Advanced Normalization Tool ...
AirVision - Advanced Normalization Tool (ANT) for Small Air Sensors
Small and inexpensive community sensors are here to stay. They can provide improved spatial coverage of an air monitoring network, but the accuracy of the data results in limited usefulness. Laboratory and field testing has shown sensors to have manufacturing biases, interferences from temperature and humidity, and errors in translating measured voltages or particle counts to regular engineering units (ppb, ug/m3, etc.). They are not quantitative, and in many cases they are barely considered qualitative. To be useful, meaningful data, any correction also needs to be applied in real-time. To be useful even as a qualitative instrument, some correction must be applied to the instruments. Sometimes that correction can be in the form of a simple calibration curve (mX+b) or polynomial correction derived by collocation of the instrument with a field NAAQS or other high-accuracy monitor.
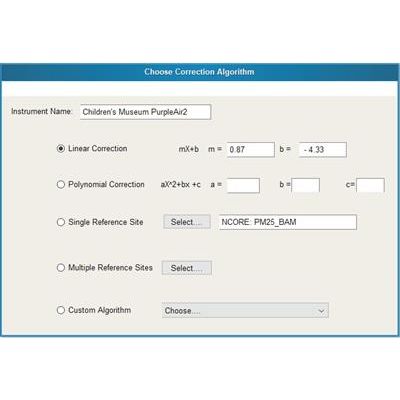
ANT can solve these problems by offering corrections in real-time, making low-cost sensor data actually useful. ANT works by applying any number of normalization techniques:
- Linear Correction
- Polynomial Correction
- Dynamic Correction from Single Comparative Monitor
- Dynamic Correction from Multiple Comparative Monitors
- Custom Corrections
In addition, ANT provides a framework for any number of new correction algorithms to be added to the system in the future, or as needed for specific instruments (e.g., advanced correction for temperature, relative humidity, or aging of the sensors).
Example of Real-Time Dynamic Correction
A PurpleAir PA2 monitor for PM25/PM10 is located relatively near a BAM, TEOM, or T640 particulate monitor at Site X. The ANT system can be set to reference the previous 14 days (user-adjustable) of data to develop a least-squares-fit correlation between the NAAQS monitor and the PA2 monitor. That correlation curve then updates the correction factor in AirVision, and the incoming data is adjusted by the new correction factor until the dynamic correction process runs again. Field data has proven that this kind of correction can significantly improve the accuracy of small sensor data, compensating for biases and interferences in real time:
For the case of multiple comparative monitors, each monitor’s correction factor is weighted against the distance from the monitor, and a resultant correction is calculated.
Traceability Of Correction Factors
For dynamic corrections, the R2 value of each correlation is stored as a ‘quality score’ for each average, so any average can be reviewed against others for relative accuracy. AirVision’s Automatic Data Validation Processor (ADVP) can be used to filter low-quality data automatically from web presentation or other data feeds.
Performance Envelope
Every instrument has a ‘performance envelope’, often a range of relative humidity, temperature, or even internal measurements from the sensor that define reasonable accuracy of the sensor. ANT can test each sensor’s value against the Performance Envelope for that sensor, and invalidate the data both for the current data stream, and for purposes of dynamic correction.
Example RH/Temperature performance envelope for sensor.
It’s Your Data!
AirVision/ANT can be self-hosted or cloud hosted, but in either case, data is not shared, sold, or remarketed and you retain 100% control and ownership of all the data flowing through the servers. If you choose to share data, AirVision/ANT offers lots of options to transfer, import, or share data sets to external web sites and visualization tools (Google, RETIGO, etc.)
AirVision Integration
ANT can be used to integrate Low-cost sensor data into an existing agency AirVision database / server, or an independent AirVision/ANT server can be used specifically for the purpose of managing low-cost sensor data networks. AirVision includes a full suite of AirVision graphical data review tools, reports, and file import/export functions. AirVision/ANT also comes with its top-rated technical support for deployment and use.
AirVision Graphical Data Review with multi-site comparison, historical comparisons, etc.
Agilaire Pi-Logger Data Bridge
Let’s face it- one of the biggest challenges facing small air sensors is data connectivity. How do you pull the data out of these devices, if they can only talk to a mobile phone or a proprietary data server?
Agilaire’s Pi-Logger Data Bridge is the solution — it uses an open TCP-based polling protocol (supported by AirVision, but useable by any other system), and can also push data to Thinkspeak servers, which offers standardized downloads, and an open JSON / HTTP interface.
The Pi-Logger Data Bridge is built from low-cost Raspberry Pi hardware, and can interface directly to RasPi-compatible sensors, and also supports sixteen (16) voltage inputs for other kinds of sensors.
- Wi-Fi or Ethernet Connectivity
- GSM Modem Option
- Four (4) USB Ports
- HDMI Port
- Sixteen (16) Analog Inputs
- Data Storage: 20+ Years
- Connectivity: Thinkspeak, AirVision, or Open Polling API
- Power: < 2W
Laboratory and field testing has shown sensors to have manufacturing biases, interferences from temperature and humidity, and errors in translating measured voltages or particle counts to regular engineering units (ppb, ug/m3, etc.). They are not quantitative, and in many cases they are barely considered qualitative. To be useful, any correction also needs to be applied in real-time.
The Solution
To be useful even as a qualitative instrument, some correction must be applied to the instruments. Sometimes that correction can be in the form of a simple calibration curve (mX+b) or polynomial correction derived by collocation of the instrument with a field NAAQS or other high-accuracy monitor. In other cases, the data can be corrected based on its proximity with nearby ‘buddy site’ monitors.