

Baseline Surface Radiation Network (BSRN)
- Home
- Companies
- Baseline Surface Radiation Network ...
- Software
- BSRN - Version Ocean Data View (ODV) - ...
BSRN - Version Ocean Data View (ODV) -Software Package for the Interactive Exploration, Analysis and Visualization
Ocean Data View (ODV) is a software package for the interactive exploration, analysis and visualization of oceanographic and other geo-referenced profile or sequence data, see http://odv.awi.de. ODV is freely available and runs on Windows, Mac OS X, Linux, and UNIX (Solaris, Irix, AIX) systems. While PanPlot2 is a useful tool to visualize time series, profile data - e.g. from radiosondes - can be better displayed using ODV.
Most popular related searches
Hints
- To distinguish between several radiosondes profiles performed within 24 hours it is recommended to reduce "Time" in the menue View/Settings/Import/Station_break_tolerances from the default value 24 to e.g. 1 hour. This has to be done just once after installing ODV.
- ODV accepts only geo-referenced data, even if all data are taken from the same location. Thus, you must choose Latitude, Longitude as parameters to convert from the Metadata with Pan2Applic in case they do not exists in the data itself.
- DATE/TIME given in the metadata from PANGAEA derived files descibes the START and the END of the measurements while the DATE/TIME information within the data describes the moment when a distinct measurement was taken. This information is needed for ODV. Thus, do not choose DATE/TIME given in the metadata while converting PANGAEA derived files for ODV using Pan2Applic.
- Install Ocean Data View (Latest ODV4.XX Version) on your local machine.
- Install Pan2Applic on your local machine. A link to Pan2Applic on your desktop is helpful.
- Download the time series you want to visualize as tab-delimeted text files (e.g. "GVN_radiosonde_2012-01.tab" till "GVN_radiosonde_2012-12.tab") on your desktop. You may do this file by file or using the Data Warehouse.
- In case you use the Data Warehouse select Date/Time as the first parameter and do not forget to select Latitude and Longitude. Otherwise ODV cannot display whole profiles but only single datapoints
- Drag the icon(s) of these files on the link of Pan2Applic which will start automatically.
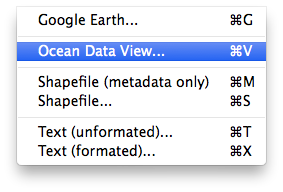
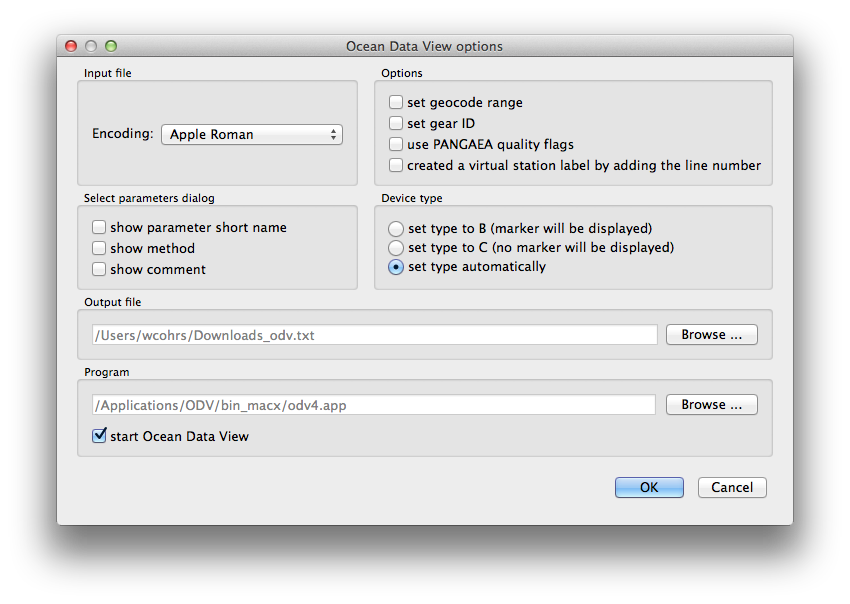
- Convert the datasets selecting Ocean Data View (ODV) from the Pan2Applic options. Be carefull that the ODV options point on the ODV program installed on your computer.
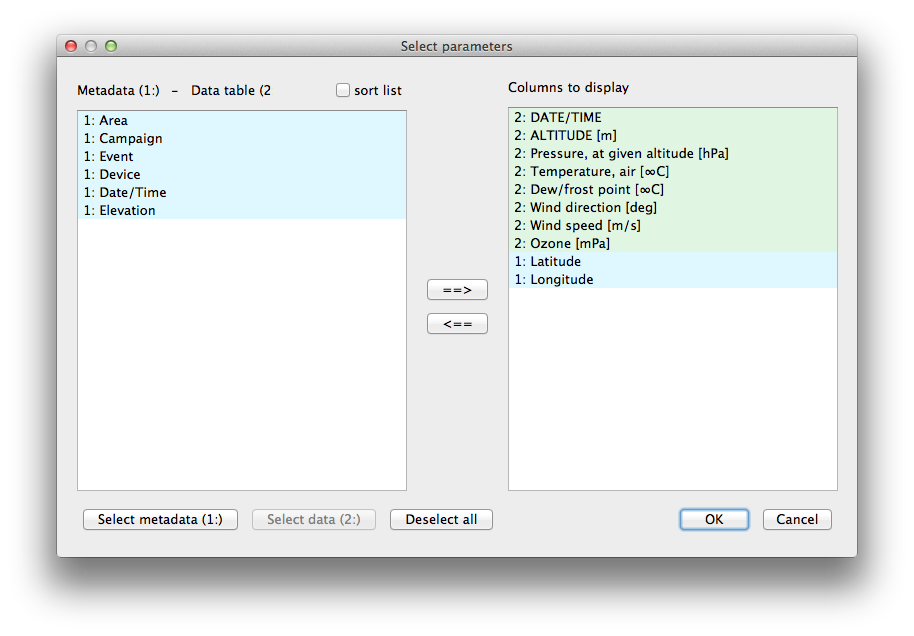
- Pan2Applic opens a parameter select box. To select all data push the lower left bottom "Select data (2)".
- Additionally ODV needs the parameters Latitude and Longitude from the metadata. In case you used the Data Warehouse, Latitude and Longitude should be part of "Select data (2)".
- Do not select Date/Time as parameter from the metadata!
- After the data conversion (press OK), ODV should open automatically.
- Select View>LayoutTemplates>1 SCATTER Window in ODV and a scatter diagram will open.
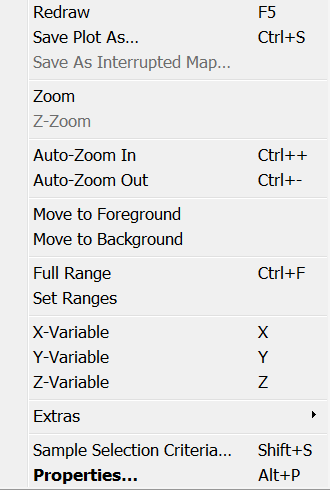
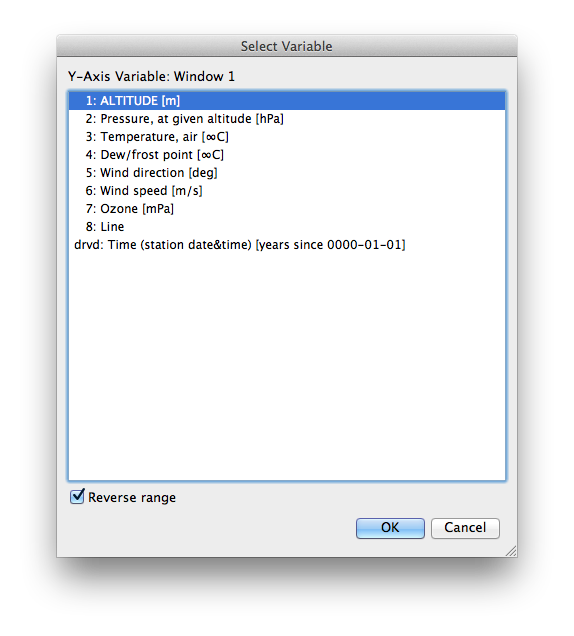
- A right click in this diagram opens the Data Plot Menu where you can choose the variables, ranges etc. as you like .
- Since ODV is primarily made for oceanic data the y-axis (altitude) is reversed. You may want to uncheck the reverse option of the y-Variable.
- Follow the steps described to visualize 2-dimensional profiles.
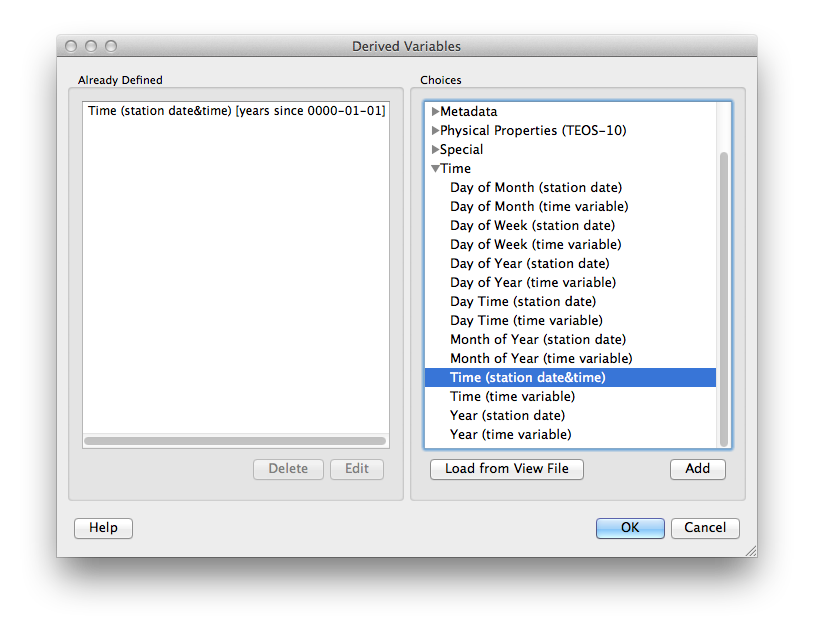
- For the X-Axis you must derive a time variable. This can be done by clicking on View>Derived Variables and then adding the derived variable "Time(station date&time)".
- Select this derived variable as X-Variable (right click in the diagram >X-Variable).
- As Y-Variable Altitude should be already displayed.
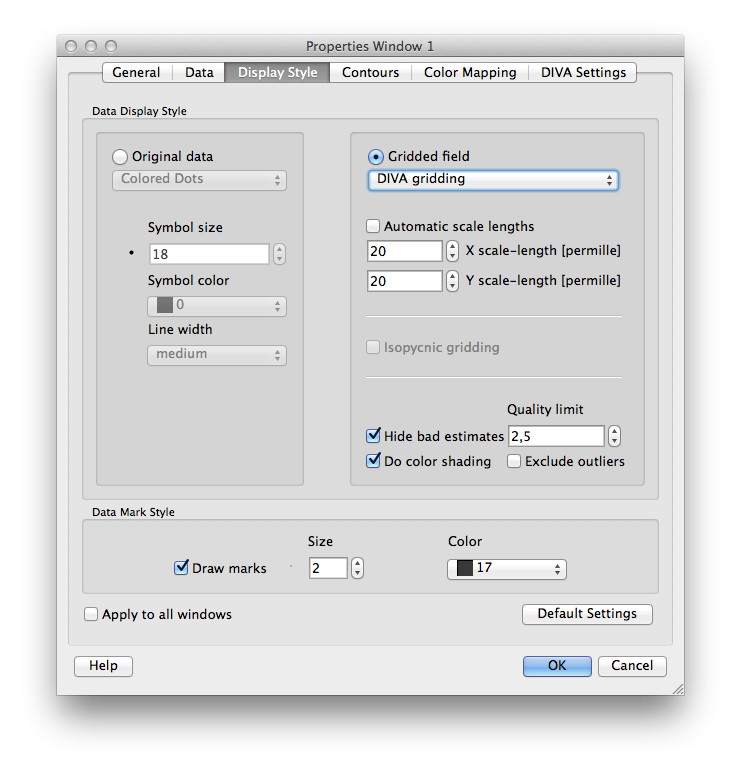
- As Z-Variable choose "O3 [mPa]" or any variable you want. A 3-dimensional time-altitude section will be displayed according to the predefined display options.
- The Display Style and other properties can be changed as desired (right click in the diagram>Properties).