

Enviro Spase - Environmental Data Analysis and Display Software
Geotech`s Enviro Spase software (pronounced like "space" for SPAtial databaSE) helps you display and analyze environmental data, such as field and laboratory data for water, as well as soil and air data. Enviro Spase runs within ESRI`s ArcGIS 10.1 or newer but does not currently run on ArcGIS Pro. It provides a full set of tools, called Wizards, to make it easy to see just the data you want, just the way you want it.
Enviro Spase works great with Geotech`s Enviro Data management software, or can accept data from other database systems. By moving the data directly from the database to the GIS map, you will save time while improving quality. And if you use it with Enviro Data, data manipulation such as converting to consistent limits and regulatory limit comparisons are done prior to any output. So if your exceedences are red in your report, they will be red on the map, with just a few mouse clicks. And it ties in with sophisticated Enviro Data features like Value and Flag display. Using Enviro Spase with your data management system brings the accuracy and efficiency of organized data management to your GIS mapping.
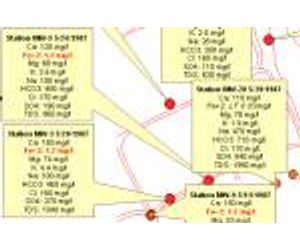
Crosstab Callout Wizard - Like the Callout Wizard, the Crosstab Callout Wizard automatically displays your data as callouts in ArcGIS. The difference is that multiple results can be shown on each line, lined up in rows and columns. The data is selected , and then displayed directly on a map, or saved to a file and displayed from that. Multiple sample dates or depths may be displayed with multiple analytic parameter values, all in neat columns.
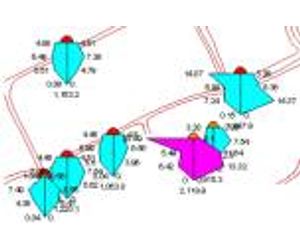
Stiff Diagram Wizard - Stiff Diagrams were invented by a hydrologist at the US Geological Survey, and described in the USGS Water Supply Paper 2254 in 1985. They are used mostly for surface and groundwater, although some people have used them for soil. Many environmental professionals are familiar with Stiff Diagrams, but in the past very few have used them due to the difficulty of preparing them. Enviro Spase makes these diagrams much more accessible by letting you draw them with just a few mouse clicks.
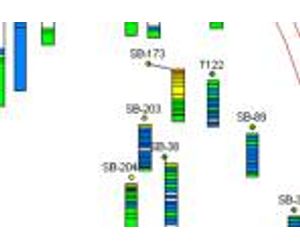
StickLog Wizard - The StickLog Wizard automatically displays your data as StickLogs in ArcGIS. The data is selected, and then displayed directly on a map at the stations selected. The display shows analytical values from samples in a borehole by one of five colors. The plots are scaled to the depth of the top and bottom of the sample. Optionally, the logs can be offset from their map location if a pre-selected X and Y offset has been entered into the database.
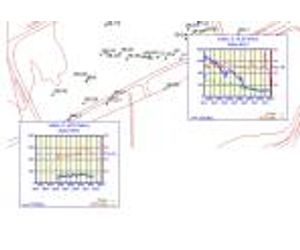
Graph Wizard - The Graph Wizard allows plotting up to twelve analytical parameter values over a time period of days, months, or years. Values are plotted on the Y-axis and dates are plotted on the X-axis. The Y-axis can have two different and independent user-defined scales so that large variations in values of different parameters can be plotted in a meaningful fashion. Each parameter graph is automatically color coded and referenced to an optional legend. The regulatory limit (if available) can be displayed as a line on the graph for one parameter.
Other Features - Enviro Spase works well with data from Geotech`s Enviro Data, or from other database systems. It ties in with sophisticated features like regulatory limit (target level) comparison and Value and Flag display. Using Enviro Spase with your data management system brings the accuracy and efficiency of organized data management to your GIS mapping.
- Inexpensive to buy
- Save time and money
- Improve project quality
- Easy to learn and use
- Impress your clients
- Best support in the industry
- Easily map your data
- Customize your displays
- Display supporting data
- Create sophisticated graphics
- Highlight important information
- Use with Enviro Data or any database