

- Home
- Companies
- SeisWare International Inc
- Software
- SeisWare - Geology Software
SeisWare - Geology Software
Accelerate geological interpretation and collaborate with technical teams and stakeholders on the fly.
Spend less time wrangling data and more time perfecting projects. Perform petrophysical analyses, manipulate logs, and launch detailed cross-sections in seconds.
Capture realistic representations of the subsurface and present clear and compelling data visualization for stakeholders, clients, and drilling teams.
Create custom workflows for your entire geoscience team and adjust a predefined library of geological and petrophysical calculations to meet your project needs.
Mapping & Contour Editing
Generate grids from displayed data with in-platform contour editing. Customize postings for well attribute data on maps, including log signatures.
Make edits to digital logs directly within your project. Tailor your log editing experience with customizable scales, displays, fills, and drag-and-drop templates.
Instantly extract log curve data along wellbores to speed up analysis. Calculate key statistics and output to diverse data formats for seamless integration with map displays.
Finally, geologic interpretation that doesn’t take geologic time
Connect SeisWare to other applications to import and export your data for you so that you can expedite your analysis and action insights as they happen.
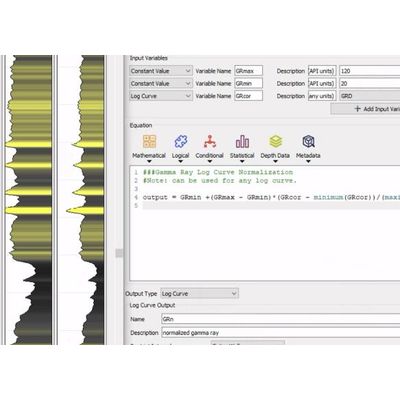
- Create, customize, and share geological calculations like Net Pay.
- Apply ready-made calculations based on Crain’s Petrophysical Handbook.
- Run multiple calculations in sequence with various inputs like log curves, log curve aliases, zone attributes, and previous calculation outputs.
- Perform aggregate functions such as summations and averages over data and output to a zone or zone attribute.
- Predict and pick formation tops efficiently in single or multi-well views.
- Maintain data integrity with clear data ownership and source documentation.
- Make more informed well decisions with rich data analysis.
- Launch hundreds of wells in seconds, generating cross-sections of regions and reservoirs at scale.
- Adjust surfaces while interpreting data in single and multi-well views.
- Generate dynamic cross-sections for hyper-realistic subsurface visualization.
- Cross-plot well and interpretation data with columnar ASCII files to analyze lithology, stratigraphy, and hydrocarbon reservoirs.
- Use 3D geological mapping software to visualize and manipulate well-log data with the Log Editor.
- Instantly correlate trends between cross-plots and mapped wells.
- Seamlessly display raster logs alongside digital logs.
- Apply raster and digital logs to your top-picking workflows for more comprehensive analysis.
- Easily calibrate any image and attach it as a raster log to any well within your project.