- Home
- Companies
- Geovariances
- Software
- Kartotrak - Contamination ...

Kartotrak - Contamination Characterization Software
Kartotrak is the first all-in-one software solution designed for an efficient characterization of soil contamination. It has been conceived for all those in charge of environmental site assessment or remediation who need to locate and estimate contaminated soil volumes confidently. Kartotrak offers an integrated workflow that streamlines the characterization process and can be used at any step of a remediation project: during the scoping and the characterization phase or after remediation to verify site compliance with cleanup regulatory rules.
QUICKLY GET TO GRIPS WITH SOFTWARE'S USE
- Kartotrak is workflow-driven to give you the best and most optimized way to your objective. Quickly handle the software thanks to a user-friendly interface simplifying learning and use.
Once parametrized, repeat the whole Kartotrak workflow in just a few clicks.
INVESTIGATE, ANALYZE, CLEAN AND VALIDATE YOUR DATA
- Load 2D and 3D data sets (samples or boreholes) from CSV or Excel files or by a fast copy/paste (in 2D): all available quantitative and qualitative information, including surface measurements, borehole data, historical data, indirect measurements, aerial views, topography, geology, lithology, physical models, buildings and buried structure locations, end up in a unique validated database.
- Explore and visualize data in 2D and 3D, navigate inside the view to search for anomalies, and better understand the contamination history and evolution.
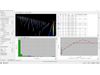
- Achieve thorough data analysis through interactive and linked-together statistical representations (base maps, histograms, cross-plots, box-plots, variograms). Identify data distribution, outliers, irregularities, heterogeneities. Spot GPS errors and correct data position.
DELIVER ROBUST CONTAMINATION AND RISK MAPS
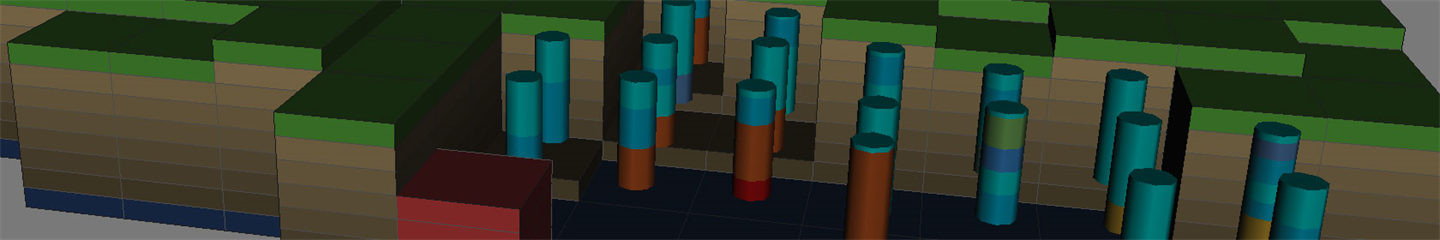
- Produce 2D and 3D contamination maps and models using kriging (ordinary) and geostatistical simulations (Turning Bands). Quantify the uncertainty related to the estimation with the variance map. Identify hot spots and locate the areas to clean up.
- Consider the correlation between pollutants and in situ measurements in a multivariate kriging process for a more consistent model and the reduction of estimation uncertainty.
- Quantify risks through conditional expectation. Get maps of the local probability of exceeding a threshold, the local quantiles according to a given frequency (quickly comparing remediation scenarios with optimistic or pessimistic hypotheses), and the confidence interval width (to identify areas showing a substantial variability).
- Classify contaminated surfaces and volumes. Contour local contamination according to waste or soils categorization.
DEFINE THE SAMPLING STRATEGY (IN 2D)
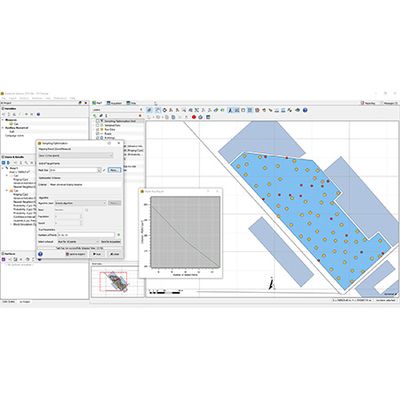
- For the preliminary characterization, set a first investigation sampling design based on regular, square, triangular, or circular meshes or set a random one. Compute the geometric probability of hitting a hot spot.
- Define the optimal number of samples from statistical tests. Locate additional samples where the uncertainty or the variability of the contamination level is the most important to improve the delineation of the contaminated area and characterization quality.
- Stream your data in real-time thanks to a specific interface enabling the connection of a GPS and measuring devices. Automatically visualize the resulting data locations and values.
ANALYSE VARIOUS REMEDIATION SCENARIOS
- Benefit from a comprehensive and innovative workflow to quantify the soil areas or volumes to remediate and associated pollutant masses considering one or several remediation thresholds related to different waste categories.
- Consider several thresholds at once for waste treatment route optimization or adopt a Pareto method maximizing masses while minimizing volumes. Benefit from multi-pollutant and multi-layer approaches for optimal remediation.
- Quickly evaluate and compare the efficiency of several remediation scenarios according to the risk of leaving soil with contamination above a remediation threshold.
- Derive the excavation depths and adapt the excavation plan to remediation constraints. Be informed on the remediation efficiency.
- Check the compliance of your site with regulatory thresholds after remediation is completed, thanks to the methods from the American guide MARSSIM (Multi-Agency Radiation Survey and Site Investigation Manual).
QUICKLY PRODUCE YOUR STUDY REPORTS
- Using Kartotrak’s integrated GIS-like geographical tools and 3D Viewer, deliver customized results displays. Export results with georeferencing information as raster images, raster data, or CSV files.
- Produce your contamination assessment report as your project progresses, editing and modifying it at your convenience through an integrated word processor. Export your report in pdf or odt format.
- Easily integrate geostatistical results into your mass balances and management plans using synthetic graphics, tables, and 3D visualization.