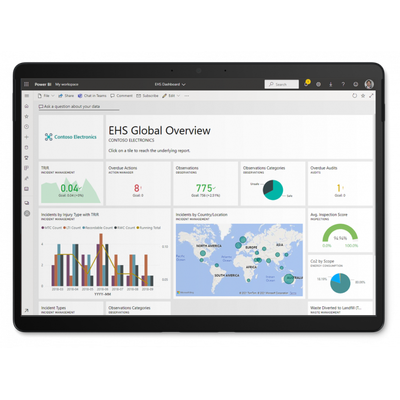
Understand how well you're achieving your EHS goals with color-coded key performance indicators (KPIs). Automatic data refresh means you're always working with the most up-to-date information, for a real-time view of how the business is performing.
Calculate important rates
Save time with Pro-Sapien's automatic calculation of rates such as TRIR. With the option to have our data loader tool pull hours worked from your HR system, Pro-Sapien's BI model lets you easily track and compare rates over time.
Global and local views
Stay high level to view trends across the enterprise, or dig into a specific location in the hierarchy. Global views for VPs, regional views for Managers, and local views for Site Supervisors ensure everyone has the information they need to do their job well.
Conduct ad-hoc analysis
Spotted something peculiar? No problem. Break out of standard reports to slice and dice your Pro-Sapien data to find the why. For example, Power BI's Decomposition Tree is a great way to visualize incident root causes or emerging observation trends.
Create your own
On top of what we configure for you, certain users can create their own dashboards and reports. Power BI's drag-and-drop interface and range of pre-built visuals empowers EHS and other business users to take control. You're not locked in to vendor reports!
Raise the profile of EHS
Pro-Sapien clients are improving EHS engagement by sharing Power BI with employees and executives alike. It's time to put EHS on the same dashboards as the rest of the business and increase awareness for a safer, more sustainable workplace.