

- Home
- Companies
- Ramas (Applied Biomathematics)
- Software
- RAMAS - Version 6.0 - GIS with ...

RAMAS - Version 6.0 -GIS with Metapopulation Software
RAMAS® GIS is designed to link your GIS with a metapopulation model for population viability analysis (PVA) and extinction risk assessment. Habitats used by most species are becoming increasingly fragmented, requiring a metapopulation modeling approach to risk analysis. Recognizing habitat patchiness from an endangered species` point of view requires spatial information on habitat suitability. RAMAS® GIS meets both of these requirements by linking metapopulation modeling with landscape data and GIS technology.
Use RAMAS® GIS to
- link your GIS to an ecological model,
- use landscape data in your population viability analysis (PVA),
- incorporate changes in habitat into a metapopulation model,
- combine geographic and demographic data for risk assessment.
New Free Tools for Developing and Analyzing Population Models with RAMAS
Recent developments make it easier to use RAMAS Metapop and RAMAS GIS to develop and analyze population models.
Using mark-recapture data
Mark-recapture data are collected by marking individuals (e.g., using bands or tags) at their first capture and recording their subsequent recaptures. This type of data is immensely valuable for estimating parameters of population models, including survival rates and fecundities. Many methods have been developed for analyzing such data, but most of them are either incomplete
(i.e., they do not allow a full population model) or are too complex. A new method, implemented as an R script, allows building fully-specified population models for RAMAS, based only on mark-recapture data (Ryu et al. 2016). It creates a fully specified RAMAS model file, which includes stage structure, standard deviations, and density dependence functions.
Its main features include:
- estimating true survival based on apparent survival estimates and population trends;
- fecundity as an unbiased estimate of juvenile:adult ratio, by using the relative capture probabilities of juveniles and adults;
- estimating density dependence in survival and fecundity;
- estimating natural temporal variability in survival and fecundity (excluding sampling variability);
- creating ready-to- run RAMAS input files;
- incorporating uncertainties and preparing the files necessary for a global sensitivity analysis (see below).
The new method, including the R script, data for case studies and sample results, is freely available at: https://github.com/Akcakaya/MAPS-to-Models.
Global sensitivity analysis
The sensitivity analysis module of RAMAS GIS (see Chapter 13 of the manual) allows analyzing sensitivity to one parameter at a time. A more comprehensive method, called global sensitivity analysis, considers all parameters simultaneously. A new method, implemented as an R package, allows global sensitivity analyses using RAMAS (Aiello-Lammens and Akçakaya 2016). The R package, including sample data and a tutorial, is freely available at https://github.com/mlammens/demgsa.
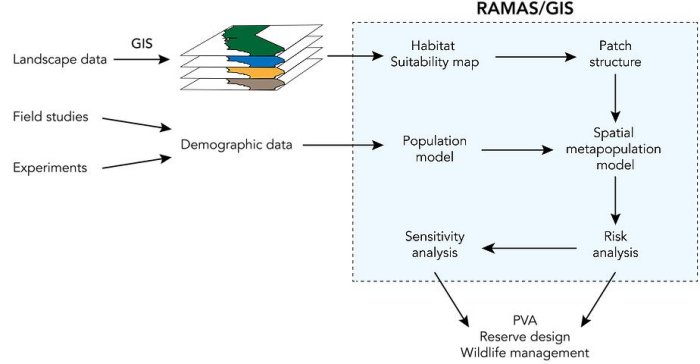
RAMAS® GIS is a comprehensive extinction risk assessment system that operates in five steps:
-
Spatial data. RAMAS® GIS imports spatial data on ecological requirements of a species. These may include GIS-generated maps of vegetation cover, land-use, or any other map that contains information on some aspect of the habitat that is important for the species (temperature, precipitation, slope, aspect, etc.). RAMAS® GIS then combines the information in all these map layers into a map of habitat suitability (HS) with a user-defined habitat suitability function.
-
Patch recognition. RAMAS® GIS uses the HS map to find habitat patches. It uses a patch-recognition algorithm and identifies areas of high suitability as a patch where a subpopulation may survive. The carrying capacity and other population-specific parameters of this patch (e.g., survival, fecundity, maximum growth rate) can be calculated as a user-defined function of the total HS, average HS, core area, patch perimeter (edge) and other habitat characteristics (from the GIS maps) for that the patch. RAMAS GIS then displays the spatial structure of the metapopulation, super-imposed with a color-coded map of habitat suitability and any other geographical feature that the user wants to include (coastlines, rivers, cities, etc.), and saves the patch structure as input for the metapopulation model. It also calculates various landscape indices (shape index, fractal dimension, edge:area ratio, etc.).
-
Habitat dynamics. If you have predictions about how habitat may change in the future (e.g., as a result of forest growth, logging, etc.), including merging or splitting patches because of habitat growth or fragmentation. RAMAS® GIS imports this information in the form of a time series of habitat maps, and creates time series of population-specific parameters for input into the metapopulation model.
-
Metapopulation model. RAMAS® GIS combines the spatial information on the metapopulation with user-input ecological parameters of the species to complete the metapopulation model. This model is identical to RAMAS® Metapop, which is described below. RAMAS® GIS contains RAMAS® Metapop, so you should not buy both programs.
-
Ecological risk assessment. The user can run the metapopulation model to predict the risk of species extinction, time to extinction, expected occupancy rates and metapopulation abundance. The output options include all results listed for RAMAS® Metapop. In addition, RAMAS® GIS has a sensitivity analysis feature that allows multiple simulations with automatically changed input parameters. You can compare results from different simulations by superimposing graphs of risk curves, time-to-extinction distributions, trajectory summary, metapopulation occupancy and other outputs.
Your GIS data layers must have the following: (i) the maps must be in raster format; (ii) all layers must be numerical; (iii) all must describe the landscape with the same precision (i.e., number of cells in both north-south and east-west directions should be the same); (iv) coverage of all maps must be identical (the corners of the rectangular area described by all maps should be the same); (v) the number of columns must be the same for each row; (vi) the "cells" (i.e., locations given a value by the map) must be arranged in a square (not hexagonal) format; (vii) the maximum number of rows and columns depend on the available memory, but each cannot exceed 16000. The formats supported are:
-
GRASS: Exported as an ASCII file from GRASS (with header). See description ofr.out.ascii in the GRASS Reference Manual. Do not use the option -h.
-
IDRISI: Raster (image) file of IDRISI in binary or ASCII format. The document or description file (.RDC or .DOC) must also be in the same directory as the image file (.RST or .IMG). The image can be ASCII (integer or real) or binary (byte, integer, real), but not packed binary.
-
ARC/INFO: Exported as an ASCII file from ARC/Info (with header). See description of the command GRIDASCII in ARC Command References in the ARC/Info manual.
-
PC ARC/INFO: Exported as a Non-compressed ASCII file from PC ARC/Info, with the command POLYGRID.
-
ERDAS: Raster gis file format of Erdas version 7.4. Only .GIS files are supported.
-
blanks: ASCII format (no header); each row of map must be in a single line (terminated by line-feed/carriage-return characters), and values must be separated by blanks. If each row takes more than one line in the file, the "fixed grid" format must be used.
-
fixed grid: ASCII format (no header); each row of map may be in one or more lines. Cell values must be separated by blanks. Number of columns (i.e., the number of cells in each row) must be specified.
RAMAS® GIS has an interactive, user-friendly menu system. Editing input parameters, displaying results, and selecting output options are done with this menu system that includes a context-sensitive on-line help facility. There is also a large set of error and warning messages, and each input parameter (whether input from keyboard or file) is checked for consistency to prevent errors. Both input data and results can be saved to disk files. Each type of result can be
-
viewed as graphs on the screen,
-
printed as graphs to a printer,
-
saved as tables to disk files,
-
viewed as tables on the screen,
-
printed as tables to a printer,
-
saved as a numerical table to a disk file,
-
exported to a spreadsheet as a data table.
The program is accompanied by a 200-page manual which includes discussions on basics of population and metapopulation dynamics, and descriptions of various menus and screens. One chapter contains a tutorial that illustrates the concepts of metapopulation dynamics with the use of several examples, and demonstrates the use of the software by guiding the user through step-by-step instructions. RAMAS® GIS comes with sample files for about 60 species, including northern spotted owl, helmeted honeyeater, California gnatcatcher, California spotted owl, land snail, blue whale, jack-in-the-pulpit, speckled alder, teasel, loggerhead sea turtle, pool frog and other species.