
RockWare - Version RockWorks -Geological Modeling Software
RockWorks is the standard in the petroleum, environmental, geotechnical and mining industries for surface and subsurface data visualization, with popular tools such as maps, logs, cross sections, fence diagrams, solid models and volume calculations. RockWorks offers numerous options for analyzing your surface and subsurface data, and accepts many different data types, such as stratigraphy, lithology, downhole geochemistry / geophysics / geotechnical measurements, color intervals, fractures, and aquifer data.
Display RockWorks graphic output in its built-in 2D and 3D viewing/editing windows, or export to CAD, Google Earth, and other GIS programs. Use the ReportWorks module to create page layouts for reports and posters.
RockWorks is offered with three feature levels so you can buy just the program tools you need:
- With Basic, the borehole processing tools are limited to observed data – no modeling: Borehole location maps, 2D and 3D strip logs, and striplog profiles and cross sections. Simple correlation panels are offered for Stratigraphy, I-Data, and P-Data in 2D section diagrams. Basic users can create playlists with up to 5 items each, and can manage three 3D faults.
- With Standard, you get all of the borehole modeling tools for the subsurface data offered in the Lithology, Stratigraphy, I-Data, T-Data, P-Data, Fractures, Aquifers, and Vectors menus, and all of the 2D and 3D diagrams and maps these menus contain. Standard users can create playlists with up to 5 items each, and can manage three 3D faults.
- With Advanced, you can connect to a SQL-Server database on a network, create playlists with unlimited items, run RockWorks command scripts for advanced automation, apply unlimited 3D faults to surface and solid models. You also have access to the tools in the well Production menu, and can import commercial PLSS land grids.
New in RockWorks: Playlists, time-based modeling, interface updates and much more!
Rockworks Feature Levels
RockWorks is offered with three different feature levels: Basic, Standard, and Advanced. Which is right for you?
The flexibility of RockWorks has made it a popular software program for generating maps, models, cross sections, and diagrams in numerous earth science industries.
Use RockWorks to represent your data with dozens of different map types: Points, contours, range-township-section boundaries, images, geology, and many specialty maps.
Rockworks Logs, Log Cross Sections, and Log Maps
Create individual logs or multi-log cross sections and maps in 2D and 3D. Arrange log columns using the interactive design windows. Display both vertical and deviated/inclined wells.
Create single- and multi-panel 2D cross sections through surface-based and block models of interpolated data: lithology, stratigraphy, geochemical/geophysical data, fractures, aquifers, colors, and vectors.
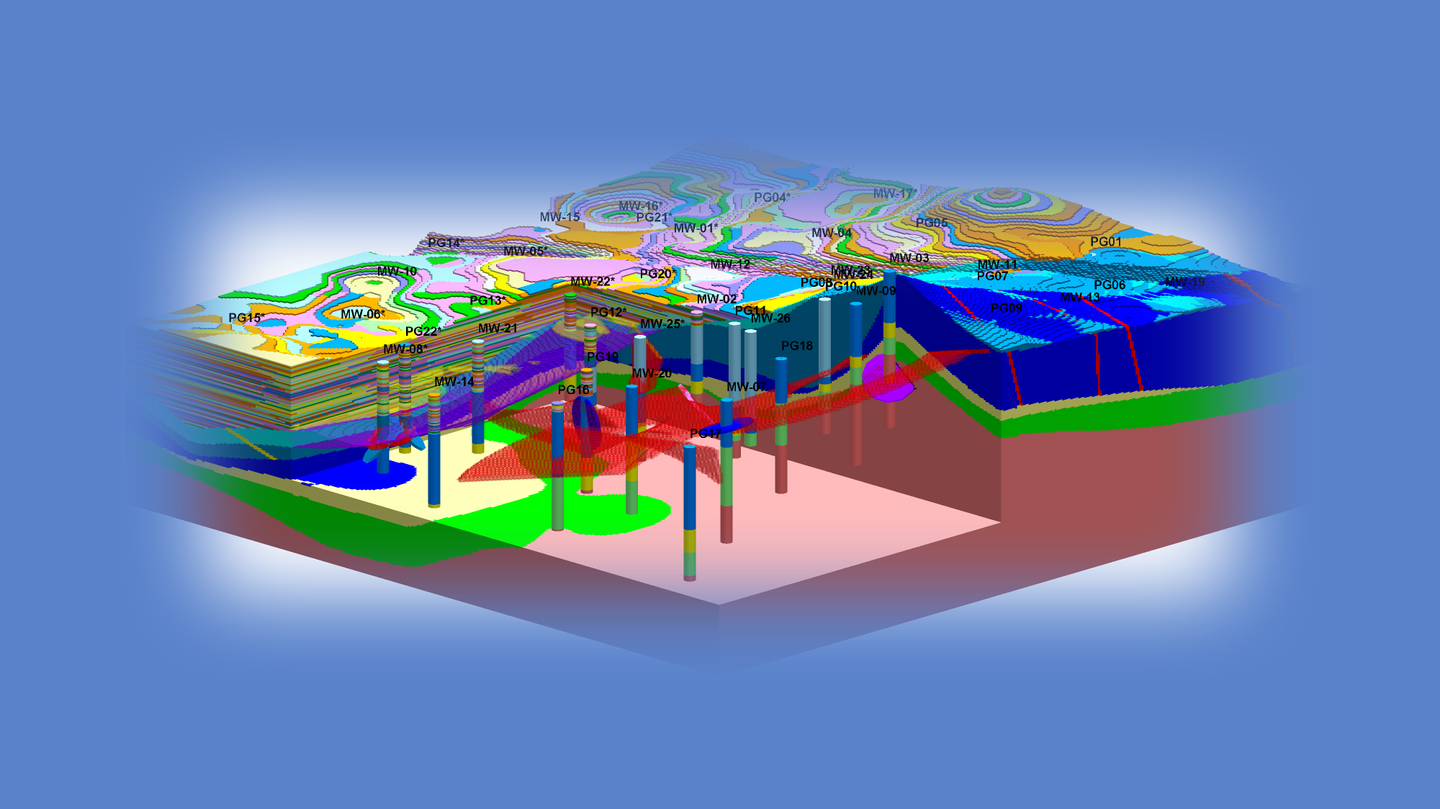
Create three-dimensional slices through surface-based and block models of interpolated data: lithology, stratigraphy, geochemical/geophysical data, fractures, aquifers, colors, and vectors. Include logs, coordinate labels, titles.
Use RockWorks to interpolate continuous 3D "solid models" or "block models" of simple XYZG points or sub-surface borehole data, for display in 3D or sliced as cross sections.
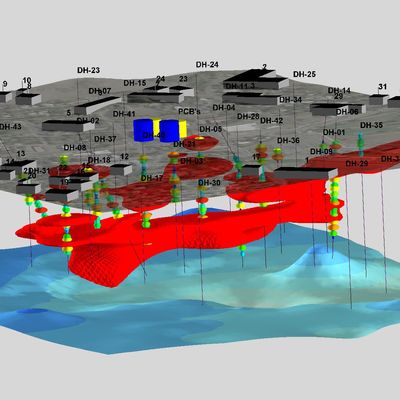
Create detailed reports and models, as well as interactive views of volume computations of ore / soil or rock materials / contaminants.
Display and model different types of downhole data: lithology, stratigraphy, aquifers, quantitative measurements, fractures, colors, and more.
Rockworks Earthapps & Google Earth Exports
Create Google Earth output from source data - point maps, flyovers, contours. Export to Google Earth from RockPlot2D and 3D - maps, models, cross sections.
Rockworks Hydrochemistry, Hydrology Diagrams
Create Piper, Stiff, Durov and other hydrochemistry diagrams, calculate water level drawdown and generate hydrographs.
Rockworks Structural Geology Tools
Use RockWorks to generate rose diagrams and stereonets - individual and in map displays - as well as strike and dip maps, lineation maps, and more.
Rockworks Import/Export Features
RockWorks offers many import and export options for data, graphics, grid models and solid models to provide connectivity to other software programs.
New in RockWorks: Playlists, time-based modeling, interface updates and much more!
New Interface Features
- New Search option lists the programs that contain your search terms.
- Favorites Option: Create your own menu list of frequently-used programs.
- Dock/Undock: Arrange main RockWorks program tabs in any configuration.
- Full-Expand Option: Stretch the main RockWorks menu across multiple screens.
- Expanded Project Dimensions Summary: View more information at a glance.
- New Layout Options: Save and retrieve up to 5 different main menu layout configurations.
- Consolidated Application Menu Ribbon: No more switching between program tabs.
- Borehole Manager Tab: New features including database comparisons.
- Playlist Tab: Automate multiple tasks in an interactive fashion.
- Faults Tab: Redesigned to manage all faults in 3D as a database.
- Execution History Tab: Review program history to diagnose problems.
- Videos Tab: Access the entire library of RockWorks instructional videos.
- Application Descriptions: Read program abstracts as you move your cursor over items within the pull-down menus.
Application Windows:
- Nested Tab Menus: Replace hard-to-read expanding/collapsing menu trees.
- Expanded Spatial Filtering: Moved to the top of menu and now applied to most applications.
- Expanded Time Filtering: Moved to the top of menu and now applied to most applications.
- Instructions Checkbox: Enable/disable help messages.
- Playlist Button: Add the current application to the Playlist.
- Favorites Button: Add the current application to your Favorites List.
- Output Options: Export diagrams and reports directly to the desired output format.
General functionality, Data, Modeling and Display
The new RockWorks Playlist offers easy automation – just click a button to add a program to the current Playlist. Then, click a button to run your Playlist to create models, maps, diagrams while you have lunch. Available for Basic (5 items), Standard (5 items) and Advanced (unlimited items).
The Playlist provides:
- Turn-key tools for colleagues or clients who need to use RockWorks capabilities without any downtime spent learning how to use it.
- A memory aid for projects that are infrequently re-visited.• An audit trail to serve as a record of what was done and all of the associated menu settings.
- Automation of data processing in which new data is being introduced on an ongoing basis (e.g. resampling and monitoring).
- A template for processing different data sets/sites using a streamlined workflow.
Embellishments
To eliminate additional steps in combining and appending diagrams, common embellishments have been added to the programs that create sections, profiles, projected sections, maps, 3D diagrams and charts.
- Sections, Profiles & Projected Sections – Additional diagram layers include perimeter annotation, surface profiles, faults, infrastructure, up to five 2D graphics overlays, peripheral annotation (titles, title blocks, legends, and image), and a border.
- Map Embellishments – Additional map layers include a background image, labeled axes, map overlays, up to five additional 2D diagrams, peripheral annotation (titles, title blocks, legends, scalebar, and image), and a border.
- 3D Diagram Embellishments – Additional 3D layers include striplogs, draped images, floating images, control point spheres, a perimeter cage, legends, 3D infrastructure, 3D faults, and up to five additional 3D diagrams.
Expanded Output Option
2D, 3D, Google Earth, and Reporting programs now include output and export options that remove post-processing steps and facilitate uninterrupted Playlist scripting.
- All programs that generate 2D diagrams now include options for simultaneously exporting the output to PDF (as raster images) and/or PNG.
- New 3D output tab includes options for exporting the diagram to a PNG image using a variety of user-specified viewing parameters.
- New Google Earth output tab includes options for specifying the initial viewer location and viewing direction.
- Programs that create reports now provide options for direct output to CSV (Excel), Txt (Notepad) or RTF (Word).