
- Home
- Companies
- Gatan/EDAX
- Software
- EDAX - Version APEX - Software for ...
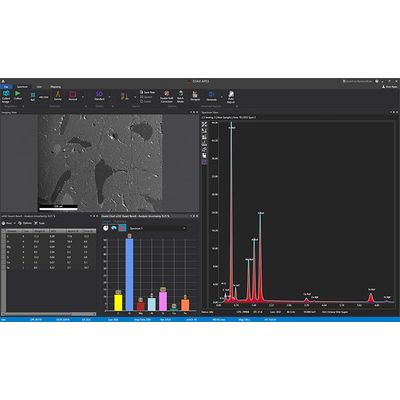
EDAX - Version APEX -Software for EDS/EDX
APEX EDS is EDAX’s premier software program for collecting and analyzing energy dispersive x-ray spectroscopy (EDS/EDX) data and the compositional characterization of materials. APEX ensures high-quality, accurate results and increased productivity with its easy-to-use interface, live-time graphical display, and simultaneous review mode analysis.
Ease of use
- Intuitive operation for novice and expert users
- Acquire and report data with as little as one mouse click
- Automate routine tasks for quick and easy analysis
- Ensure everyone has the right level of access with profile-based logins; from individual users to administrators
Customization
- Selectable color scheme to match the scanning electron microscope (SEM) interface or user preferences
- Display configuration options to show data according to user preferences
- Resize and arrange data windows according to your requirements
Simultaneous Live and Review mode Improve the efficiency of your experiment by simultaneously collecting a spectrum, linescan, or map while you evaluate data and generate reports.
Real-time results
- Immediately identify and display elements using Element ID
- Dynamically edit elements for the most accurate and efficient analysis
- Easily understand your sample`s composition using the live quantification statistics and graphical results
Smart quant
- Use ZAF-corrected spectral analysis for quantitative compositional information
- Simultaneously perform quantitative analysis during spectral data collection with no delay in the acquisition
Full standards quant
- Flexibility to search, select, and combine standards
- SmartStandards mode for intelligent selection of best fitting standards for accurate quantification results
Multipoint analysis
- Utilize Survey mode to perform point sampling quickly
- Mark and analyze several locations on a sample to improve your data collection efficiency
- Save and recall Multipoint scan lists to automate data collection and analysis
Data management and reporting
- Project tree storage for seamless management of all data
- Project exports to *.hdf file format
- Save windows with one-click as *.bmp, *.jpg, *.png, or *.tif images
Advanced reporting
- Directly generate reports from the APEX Live mode to shorten your time to results
- Use Report Designer to customize presentation templates for images, spectra, quantification results, text, logos, and sample information
- Easily compare data from multiple areas or samples in the same report
- Combines multiple templates to display results easily
- Automatically create reports immediately after data collection is complete
EDS mapping
- Counts per second (CPS) map showing count rate quality at every pixel displayed to provide a CPS distribution and highlights variations caused by surface features
- CompoMaps separate contributions from overlapping peaks to individual elemental maps for more accurate representations of EDS maps
- Quickly activate and add elements while mapping to simplify operation and inspection
- Select from 40 color options to effortlessly create vibrant images during elemental mapping
- Simultaneously map multiple element lines (K, L, M)
Dynamic Element Mapping
- Interact in real-time to show only the elements while in Mapping and Linescan modes
- Edit elements, element lines, and user-selected regions of interest during map collection
Montage large area mapping
- Scan large areas using stage movements to collect multiple fields of analysis
- Automatically stitch data into a single file for comprehensive analysis
Smart Phase Mapping
- No user setup required
- Automatically collect spectra, elemental, and phase maps
- Customize the name and color selection of phases
- Predefine or reanalyze phases based on spectra
Dual detectors
- Mitigates shadowing and topographic artifacts
- Option to merge spectra/compositional maps from both detectors
- Doubles throughput count rate while maintaining single detector energy resolution
- Better resolution stability versus systems with one detector with a large sensor
- Averages quantitative analysis from two detectors to build more accurate results
Enhanced linescan acquisition
- Configure spectra collection for efficient analysis of compositional gradients
- Real-time overlay and scaling of the Linescan chart enables easy correlation of compositional data with image features
- Avoid samples errors when you use Linescan with drift correction in the APEX Advanced software package
Live drift correction
- Automatically set drift parameters for easy operation
- Dynamically adjusts the correction frequency based on the drift magnitude for robust correction performance
- Advanced correction options available to save drift images and define manual reference area
- Available in Spectrum, Linescan, and Mapping modes for quality data in all collection modes
Spectrum Match
- Use the optional feature to allow users to search through a spectrum library to find similar spectra
- Simplify identification of unknowns by comparing them to potential candidates and reduce the complexity of finding discrepancies and similarities between spectra
- Create and use your unique spectrum library for Spectrum Match
- Match a collected “unknown” spectrum to a library of reference spectra using the Smart Materials and Minerals Library option