

- Home
- Companies
- Locus Technologies
- Software
- Locus - Visual Analytics Tools
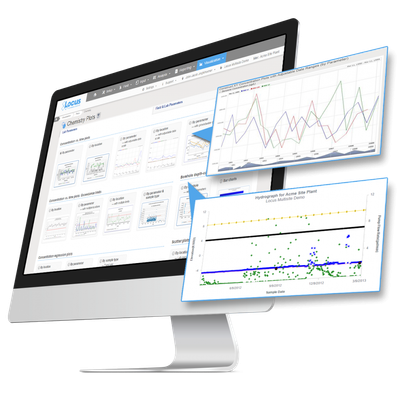
Locus - Visual Analytics Tools
Locus visual analytics tools reveal critical trends and patterns in environmental data. Environmental data is vast. And complex. While these massive datasets are rich with information, it’s tough to derive actionable insights from countless rows and columns. Visual analytics are the answer. Data visualization tools chunk data for display in visual formats like grids, charts, or maps. These visual representations of complex data effectively convey the meaning of the rows and columns, and they can be assembled within Locus dashboards for simple monitoring. But they don’t stop at helping analysts and non-technical users to interpret current impacts. Visual analytics help users quickly grasp trends and forecast implications, such as using GIS to predict the likely migration path for a contaminant.
- Reveal important patterns that are hiding in plain sight.
- Convey technical information to non-technical audiences.
- Identify trends and predict impacts.
- Make faster and more informed decisions.
- Connect to specialized 3rd party tools for GIS and visualization.