
Northwest Environmental Training Center (NWETC)
- Home
- Companies
- Northwest Environmental Training Center ...
- Training
- Visualizing and Analyzing Environmental ...
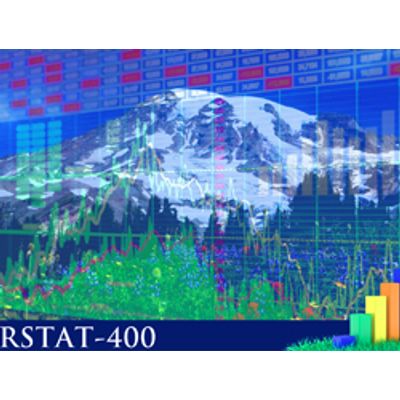
Visualizing and Analyzing Environmental Data with R
This course is designed for participants who wish to gain beginning to intermediate skills in using R for manipulating, visualizing and analyzing their environmental data. R is a comprehensive statistical programming language that is cooperatively developed on the Internet as an open source project. This freely available statistical package R is a powerful tool and is projected to become the most widely used statistical software.Most popular related searches
Course Topics
- Installing R and R libraries
- Reading and writing data (read(), write()) and viewing R data sets
- Creating new variables and recoding or renaming variables
- Manipulating data (order(), merge(), aggregate(), t(), which())
- Summarizing data (sapply(), summary(), table(), xtabs())
- Visualizing data (par(), plot(),hist(), points(), line(), barplot(), pie(), boxplot())
- Statistical analysis (cor(), t.test(), lm() and regression diagnostics)
- R programming basics (program control and user defined functions)