

- Home
- Companies
- Efficiency Scientific Instrument Co., ...
- Applications
- Direct Determination Of 11 Elements In ...

Direct Determination Of 11 Elements In Iron Ore Using The Ore Analyzer EDX9000Bplus - Metal
The EDX9000Bplus energy dispersive X-ray fluorescence spectrometric ore analyzer offers rapid determination and precise results. Once an optimal detection calibration curve is established, it exhibits several outstanding features: Direct determination of iron ore samples is possible, enabling the simultaneous quantification of multiple elements with relatively minor errors. No additional chemical reagents are needed apart from iron ore standard samples, eliminating the generation of wastewater and waste gas, thus posing no environmental or operator hazards. It provides a swift determination speed and high detection efficiency, significantly reducing the detection cycle and is particularly well-suited for the rapid analysis of iron ore samples.
Iron ore represents one of the earliest mineral products harnessed in human history. It serves as the principal raw material for steel production and constitutes the bedrock of the modern industrial landscape. In the past, the focus predominantly centered on the iron content and the corresponding detection methodologies. However, with the expansive application of iron ore, the concentrations of other elements have also come under the spotlight. The advancements in science and technology, along with the evolution of techniques, have unfurled novel prospects for the detection of iron ore. The X-ray fluorescence spectrometric ore analyzer EDX9000Bplus embodies an analytical testing technique that is capable of concurrently determining multiple elements with remarkable rapidity. Beyond employing standard samples to delineate calibration curves, it can effectively address the analytical testing conundrums of traditional industries, proffering favorable economic and social dividends and being conducive to environmental preservation and human well-being.
Sample Preparation
The iron ore samples ought to be sampled and prepared in strict accordance with national standards. All samples must pass through a 0.085 mm standard sieve and be loaded into the specialized cups designed for ore analysis samples of the instrument, with a thickness of no less than 15 mm.
Calibration Curve Plotting
By utilizing national iron ore standard samples, under the predefined conditions of the instrument, the characteristic X-ray fluorescence intensities of the elements to be determined within the iron ore standard samples are measured. Taking the element contents as the horizontal axis and the fluorescence intensities as the vertical axis, the calibration curve is plotted.
According to the theoretical framework of the fundamental parameter method, the aggregate of all the determined elements and their oxides should amount to 100%. Based on this principle, the determination is carried out. Typically, the primary constituents of iron ore are iron and its oxides. In this method, Fe2O3 is employed for determination, and the results are expressed in terms of Fe. The secondary components encompass silicon, calcium, potassium, sulfur, and their respective oxides, among others. After optimizing the determination conditions, five elements, namely iron, potassium, silicon, calcium, and manganese, are determined via the fundamental parameter method model.
Owing to the element interference between the main and secondary components as well as the matrix effect, certain elements with relatively low abundances or those proximate to the interfering elements in the periodic table of elements are susceptible to interference. The linear regression of the calibration curves for six elements, including magnesium, titanium, lead, aluminum, phosphorus, and sulfur, is comparatively suboptimal. After rectifying them through the intensity correction method, the calibration curves are obtained.
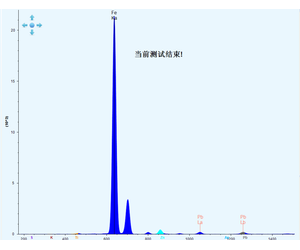
The typical spectra of iron ore are presented as follows:
Comparison of Determination Methods
There exists a plethora of analytical testing methods for iron ore. The national standard "Methods for Chemical Analysis of Iron Ore" (GB6370) nearly encompasses the detection of the principal valuable elements and harmful elements in iron ore. The primary detection modalities include the gravimetric method, volumetric method, spectrophotometric method, FAAS method, ICP-AES method, ion-selective electrode method, atomic fluorescence method, polarographic method, X-ray fluorescence spectrometric method, etc., incorporating both traditional chemical analysis techniques and modern analytical testing technologies. The FAAS method is utilized to determine four elements, namely calcium, magnesium, potassium, and sodium. The atomic fluorescence method is employed to determine five elements, such as arsenic, mercury, cadmium, lead, and bismuth. The ICP-AES method is used to determine seven elements, including aluminum, calcium, magnesium, manganese, phosphorus, silicon, and titanium. All these determination methods necessitate sample pretreatment. In contrast to traditional chemical analysis methods and other testing techniques, the energy dispersive X-ray fluorescence method for determining 11 elements, namely iron, potassium, silicon, calcium, manganese, magnesium, titanium, lead, aluminum, phosphorus, and sulfur, boasts four merits: Upon constructing the determination models of the fundamental parameter method and the intensity correction method, the determination of 11 elements in the iron ore samples can be accomplished in a single operation; Except for the utilization of iron ore standard samples, no other chemical reagents are required; It does not generate wastewater or waste gas, thus posing no harm to the environment or operators; The samples do not require pretreatment, the determination speed is swift, and the detection efficiency is high, particularly being apt for the rapid detection of iron ore samples.
In chemical analysis testing, the chemical pretreatment of samples is exceedingly intricate, entailing high labor intensity and a protracted operation time, accounting for over three-quarters of the time and cost of analytical testing. Moreover, disparate sample pretreatments frequently culminate in divergent determination results, and even the determination results may deviate due to inappropriate sample pretreatment. As the foundational task of analytical testing, sample pretreatment has invariably been accorded great significance by analytical testing personnel. When the energy dispersive X-ray fluorescence spectrometer EDX9000Bplus is employed to determine iron ore, the samples do not necessitate chemical pretreatment. They merely need to pass through a 0.085 mm standard sieve and be loaded into the specialized cups of the instrument.
Under the preset instrument conditions, characteristic X-ray fluorescence intensities of the elements to be measured in national iron ore standard samples are determined. Subsequently, a calibration curve is plotted with the element contents on the abscissa and the fluorescence intensities on the ordinate.
In line with the theoretical model of the fundamental parameter method, it is required that the sum of all determined elements and their oxides amounts to 100%. Generally, the principal constituents of iron ore are iron and its oxides. In this particular approach, Fe2O3 is employed for the determination, and the final results are presented in terms of Fe. The secondary components encompass silicon, calcium, potassium, sulfur, and their respective oxides. After optimizing the measurement conditions, five elements, namely iron, potassium, silicon, calcium, and manganese, are quantified using the fundamental parameter method model.
Nevertheless, due to element interference between the main and secondary components as well as the matrix effect, certain elements with relatively low abundances or those positioned adjacent to interfering elements in the periodic table are susceptible to interference. As a result, the calibration curves of six elements, including magnesium, titanium, lead, aluminum, phosphorus, and sulfur, exhibit relatively poor linear regression. These curves are then corrected via the intensity correction method to obtain the final calibrated curves.
The typical spectra of iron ore are shown as follows: