

MapMakers Group Ltd. software
The GIS Meteo Application Suit
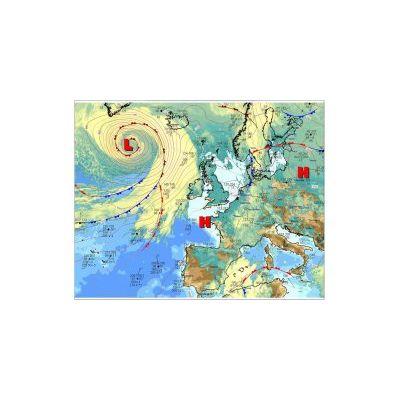
MapMakers - GIS Meteo General Software
GIS Meteo provides you with the following opportunities: Analysis of surface and high-altitude weather charts. Forecasting of beginning, evolution and relocation of baric formations and weather fronts. Forecasting of surface winds, surface air temperature, surface air moisture, cloud formations, precipitations, fogs and visibility, weather phenomenon and natural hydrodynamic phenomenon. Flammability risks forecasting, special forecasting for various sectors of national economy. Evaluation of the forecasting quality of various meteorological parameters received from different data sources. Special medium-term forecasting for the needs of various sectors of national economy. Amendments of prognostic fields in boundary layer, based on physiographic and weather statistical data.
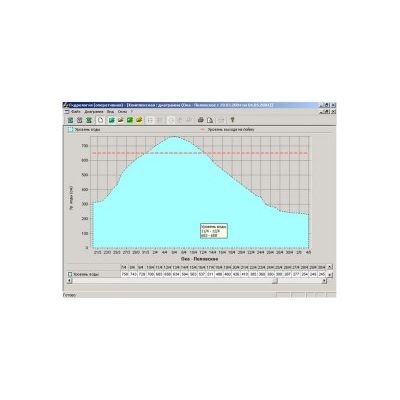
MapMakers - GIS Meteo Hydro Software
GIS Meteo Hydro provides hydrological departments with the following opportunities: Observation of small, medium and large rivers conditions, observation of reservoirs conditions, systematization of hydrological observation data, control over snow coverage condition in forests and agricultural holdings, maintaining journals. Forecasting of water flow and runoff volumes, reservoirs inflow, water and ice phenomenon forecasting, ice thickness forecasting, forecasting of threshold values of hydrological phenomenon, special reports, reference information of water bodies regimes (used for various economy sectors, such as energetic, water transport etc.). Various long-term forecastings. Hydrological phenomena warnings and wind wave height forecasting for lakes and reservoirs.
Other Products
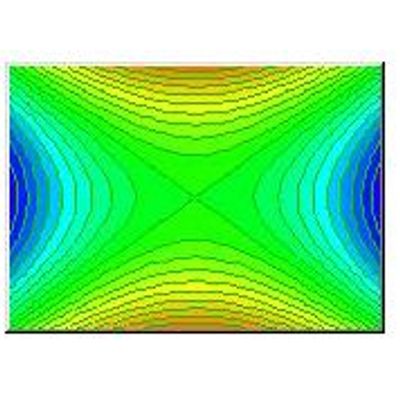
MapMakers - MM Contours ActiveX Control
The MM Contours ActiveX control is designed to visualize the data given in the random set of points on a plane. Each point is defined by its coordinates x and y and the value v – this is often called as XYZ data. The data are not obliged to be given at nodes of a regular grid, as it frequently is required in similar tools. The MM Contours control provides the algorithm of construction of a regular grid from your irregular data. The control can visualize the data in the form of contouring and/or shading. The labeling of local extrema is also included.