With our web-based air quality monitoring software – Oizom Terminal, the professionals can access and analyze the air quality data remotely from anywhere. After monitoring the environmental data, its analysis and visualization become essential to comprehend the entire scenario. Data from air quality software can be presented in various forms depending upon the customer’s requirements such as creating public awareness, statistical analysis, performing studies, etc. The analytics feature of the AQI software helps to identify the root cause of the problem and suggest possible actions. The primary purpose is to breakdown the complex environmental data to make it comprehensible for the consumer.
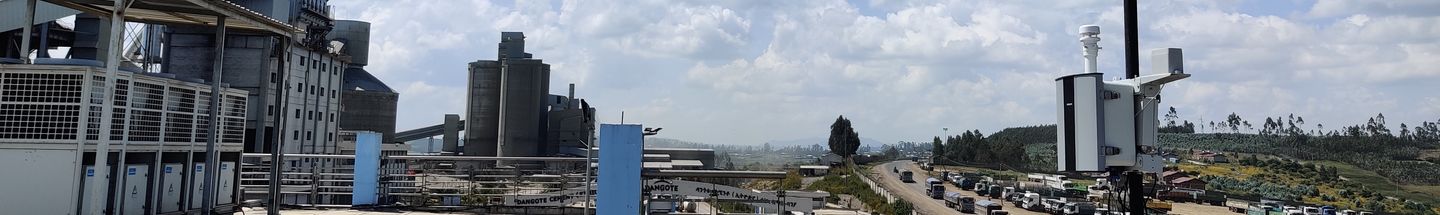
Our Air quality monitoring software - Oizom Terminal, provides a macro picture of the environmental condition of all the selected locations. It represents real-time environmental data in a geo-mapped visualization along with calculated Air Quality Index. The air quality software shows the concentration of each environmental parameter being monitored along with the calculated AQI. You can observe the real-time pollution data along with weather parameters like wind, temperature, and humidity. The colour-coded index is deemed necessary to understand and interpret the concentration of various pollutants.
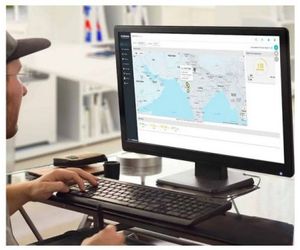
Air Quality Software - Oizom Terminal’s dashboard module provides a detailed representation of the environmental data from each air quality monitoring equipment. The terminal dashboard allows users to visualize the environmental data with interactive charts, graphs and data tables. The dashboard exhibits Pollution Rose and Wind Rose Chart to represent the pollution dispersion along with the wind. It also displays the ambient noise pollution via a Noise Chart. The average Air Quality Index (AQI) is also provided for each parameter concentration as hourly average and real-time data. A detailed box plot enables air quality trend analysis.
The Analytics module of Oizom terminal - air quality monitoring software, provides three ways for analysis - location, parametric, and time-span comparisons. The web-based aqi software provides Location Comparison, which allows comparing the data of two or more equipment installed at different locations for a particular parameter for a fixed period. Parametric Comparison allows comparison of multiple parameters of one location for a selected time. Time-span Comparison analyzes the parametric data of a location for different time slots such as morning vs evening-peak hours.
Oizom mobile app allows users to visualize the air quality of their city and compare it with AQI of hundreds of cities around the world on the go. The user-friendly app also generates alerts every time there is a pollution threshold breach. The aim is to make environmental data accessible to each individual for increased public awareness through the mobile app. This can simulate the precautionary actions by the citizens for their day-to-day activities to achieve better health.
Accurate and Affordable Air Quality Monitoring Solutions. Oizom offers a end-to-end and scalable solutions for real-time air quality monitoring and advanced data analytics. Oizom has a range of environmental monitors, each designed keeping in mind the various applications where monitoring air pollution is crucial. Through our real-time air quality measurement devices, we monitor various environmental parameters such as air quality, polluting gases, odourful and toxic gases, noise, weather conditions, radiation, ...
Elemental chlorine is a highly reactive, greenish-yellow gas. It has a suffocating, irritating, and pungent bleach-like odour that is detectable at low concentrations (above 0.3 – 0.5 ppm). ...
Real-time Ambient Air Quality Monitoring Applications Oizom specializes in manufacturing and designing accurate Air Quality Monitoring systems and offering advanced data analytics. Founded in 2015, ...
Almora being a popular hill station in Northern India attracts many tourists over the year. This gives rise to vehicular pollution and increases the particulate matter pollution in the region. Hence, ...
It is now a well-established fact that exposure to poor air quality leads to serious health conditions. These health impacts on populations have led to a massive economic burden on economies around ...
Our ClientPollucon Laboratories is one of the most diversified testing service providers in India. They conduct monitoring and analysis of all environmental parameters in air, water, soil and ...
Methyl mercaptan (CH3SH), also known as methanethiol, is a colourless, highly flammable, toxic gas with a distinct, strong unpleasant odour. Moreover, microbial degradation of organic matter releases ...
Methane has a direct influence on climate change as well as an indirect effect on human health, plant yield, and productivity due to its role as an important precursor to ground-level ozone ...
Total Volatile Organic Compounds (TVOC) are a group of compounds containing carbon that have a high vapor pressure present in the air. There are abundant VOC emitted from everyday activities among ...
H2S is formed whenever elemental sulfur or sulfur-containing compounds come into contact with organic materials at high temperatures. Continuous or high-level exposure of the H2S can quickly deaden a ...
Ammonia is a colorless, toxic, irritating gas with a pungent odor that is as a result released from decaying organic matter, including plants, animals, animal wastes, and fertilizer ...
Ground-level ozone is harmful to human health and the environment, especially on sunny days when its concentration can reach high levels. Also, it is a precursor of photochemical smog, which has its ...
SO2 monitoring is an efficient way to detect and reduce exposure to sulfur oxides which further benefits in reducing the formation of particulate sulfur pollutants like fine sulfate particles, acid ...
NOx, apart from affecting human health and the environment itself, has the potential to produce “secondary pollutants” such as ozone, smog, nitric acid, and particulate matter. Also, ...
Carbon monoxide, one of the most abundant pollutant gases. The gas is indetectable to humans as one can not see, smell, or taste. However, exposure to high levels of CO can cause CO poisoning leading ...
What is PM100?“PM” (Particulate Matter) is not a single pollutant but refers to a complex mixture of solids and aerosols of varying shape, size, and chemical composition. It may contain ...
What is PM10?“PM”, Particulate Matter, is not a single pollutant, but refers to a complex mixture of solids and aerosols of varying shape, size, and chemical composition and may contain ...
What is PM2.5?“PM”, Particulate Matter, is not a single pollutant, but refers to a complex mixture of solids and aerosols of varying shape, size, and chemical composition and may contain ...
Air quality data serves as the basis for all pollution mitigation strategies. A comprehensive air quality monitoring network provides valuable data insights to support effective air pollution ...
Environmental monitoring systems generate incredible amounts of data each day. The opportunity of putting such valuable data at work is missed if the data cannot be converted into timely actions. ...
Odour is the perception of smell; it may range from being unpleasant (like the rotten smell of garbage) to pleasant (fragrance). Odours, pleasant or unpleasant; are produced by inhaling air-borne ...
Monitoring the pollutant concentration is fundamentally important to develop and evaluate pollution control strategies. It enables us to understand the trend and extent of pollution by identifying ...
Air pollution with its cascading effects across the population has become a serious matter of concern. To address this air pollution problem, availability of accurate and reliable air quality data is ...
Air pollution is often based on the values of particulate matter of size less than 2.5 micrometers(PM 2.5) and particulate matter of size less than 10 micrometers (PM10).PM 2.5 reduces ...
Clean air is the basic amenity when it comes to healthy living for mankind. Today poor air quality is one of the main reasons for several acute health diseases. It is essential to know the air ...
It was yesterday that we read the news where WHO reported 14 out of 20 most polluted cities are in India. The same day, the whole Rajasthan and UP were shrouded in a deadly dust storm and rains that ...
OverviewHigh levels of PM10 and PM2.5 are rapidly degrading the air quality of Agra city as well as one of the wonders of the world – Taj Mahal. The increasing pollutant level is mainly due to ...
Customer reviews
No reviews were found for Oizom - Web-Based Air Quality - Environmental Data Software for Visualization & Analytics. Be the first to review!