
- Home
- Companies
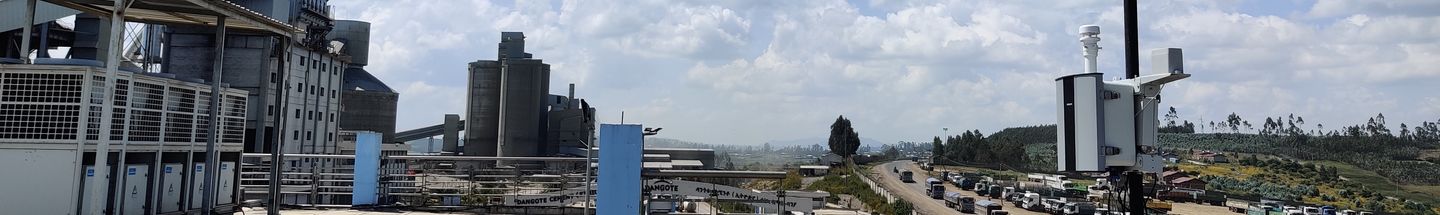
- Oizom Instruments Pvt. Ltd.
- Software
- Envizom - Web-Based Air Monitoring ...


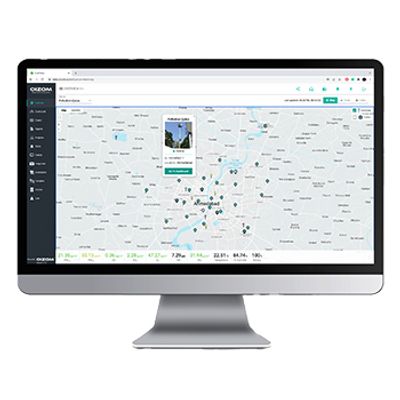
Envizom - Web-Based Air Monitoring Software for Professionals
Envizom is an Air monitoring software for real-time air quality data acquisition, visualization, and analytics. The Oizom environmental data interpretation engine fetches the data from Oizom equipment. On receiving the data, the engine runs necessary corrections and compensation algorithms. Envizom uses secured HTTPS servers for data storage. Alternatively, this data can also be stored on-premise local servers. The dashboard module shows the data in different chart formats, whereas, in the Overview module, the devices can be seen geo-mapped to their respective locations. In addition, Envizom also offers modules like Automated Reports, Smart Alerts, and Process automation.
Data Privacy
Envizom receives the data from the Oizom equipment through a highly secure network. The data shared between the client uses an encryption server through HTTPS Secure Socket layers. In addition, the Envizom Air Quality Monitoring Software uses AES encryption for connection that adds to data safety.
Data Ownership
Users can access the data from the equipment using a unique user-based authentication. The Envizom creates a secured and encrypted password combination for the user login. Oizom ensures 100% privacy of the data and doesn’t share without relevant permissions. Envizom
Data Transparency
The data collected from Oizom equipment runs through a data interpretation process with various algorithms. It eliminates the interference caused by the environmental impact on the sensors. The device performs all the corrections and sends the data to the database for visualization and analytics.
Real time data
Envizom platform offers real time data visualization of all environmental parameters.
Smart alerts
Set alerts based on predefined threshold values and send notifications to the respective users through SMS, Email and push notifications.
User friendly interface
Envizom platform is user-friendly and navigation across modules is hassle-free and interactive.
Endorse your brand
Users can customize their Envizom platform and endorse their brand by updating their logo in the application.
Process automation
Enable process automation using our relay-based module and set thresholds to automate the integrated systems.
Easy to Set Up
A simple 2 two-click setup application to access data from anywhere.
One click Share
Share quick custom reports with desired users from the application with a single click.
Data accessibility
Access real-time on the go from any internet power device like, a laptop, tablet, mobile phone, etc.
Easy to Integrate
Through our REST APIs data from all the Oizom equipment can be integrated into any 3rd party platform.
Set Clusters
Users can create their own clusters by combining data points based on the location e.g Residential, Industrial, City centre etc.
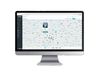
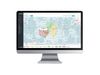
Overview and Dashboard
- Geo-tagging of environmental equipment on the map.
- Access real-time environmental data in a tabular format. Visualize environmental data in 1, 8, and 24-hour data formats.
- Visualize and download environmental in informative chart formats.
- Download the environmental data in CSV format for further analysis.
Cluster
- Group geography-specific equipment as per requirement.
- Assign different data indexes to other sensor groups, i.e., Industrial, Urban, Vehicular.
- Users can add multiple clusters as per the requirement.
- This cluster data is available in 1, 8, and 24-hour data average.
- Download data in CSV format.
Reports
- One-click download of auto-generated reports in pdf format.
- Schedule daily, weekly, and monthly automated reports to registered email IDs.
- Generate quick reports as per user requirements.
- Print-ready reports in tabular and chart format.
Alerts and Notifications
- Users can set alerts based on predefined thresholds.
- Receive instant alerts on Email, SMS, and notifications.
- Access quick notifications on equipment health and battery status.
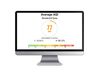
Analytics
- Comprehensive analysis of environmental data.
- Users can compare and analyze various parameters, equipment, and chronology.
- Analyze the data in line, area, column, and area-spline charts.
- Download, share and save the diagram for future references.
Display
- Create custom display and showcase on LED, LCD boards like TVs, Monitors.
- Ready to use display templates like Equipment data Comparison, AQI Comparison, Parameter table.
- Generate desired iframe-based widgets as per requirements.
Integration
- Secured REST APIs for integration into 3rd party platforms.
- Integrate HTTP APIs from 3rd party devices into Envisuite Platform.
- Upload 3rd party device data through CSV files into Envisuite Platform.
Device Management
- Edit equipment-related information like Device Name, latitude, longitude, location.
- Enable or disable equipment data as per requirement.
- Manage data interval for Oizom equipment.
User Role Management
- Admin can create multiple users and provide them access to specific equipment and modules.
- Users can select their desired data unit format, e.g., ppm, ppb, µg/m³
- Select AQI types based on your geography.
Automation
- Set parameter configurations to enable automation.
- Configure relay from anywhere
- Integration of the relay with 3rd party devices for process automation